
The Backbone of a Living Infrastructure Asset Management Plan In Power BI is Seamless Data Connectivity🛣️📉💰🌏
- Jill Singleton

- Jun 27, 2025
- 11 min read
Updated: Jun 28, 2025
In last month’s post, I discussed how to build a dynamic, Living Infrastructure Asset Management Plan (IAMP) using Power BI. https://www.iamdata.solutions/post/building-a-living-infrastructure-asset-management-plan-in-power-bi
Since then, several people, particularly those working with asset data in local government, have reached out with questions about one particular key aspect - data connectivity.
How does Power BI actually connect to different systems? And why is that connection so critical to making an AMP truly ‘living’?
In this month’s post, I’ve taken the opportunity to explore those questions in more depth. At the heart of a Living AMP is the ability to reflect up-to-date, integrated data from across your organisation ensuring that decisions are made with confidence, relevance, and timeliness. Let’s take a closer look at how Power BI makes that possible.

Welcome to the Iamdata Solutions Asset Management Newsletter - July 2025
Seamless Data Connectivity
Traditional asset management plans often suffer from data latency, where information becomes outdated soon after publication. Power BI addresses this challenge by offering robust data connectivity options, enabling continuous data integration and real-time updates.
Diverse Data Source Integration
One of Power BI’s most powerful features is its ability to bring together data from a wide range of sources. In the context of a Living Asset Management Plan, this means drawing on multiple systems such as finance, operations, maintenance, GIS, customer service, just to name a few, to create a unified, real-time view of your assets.
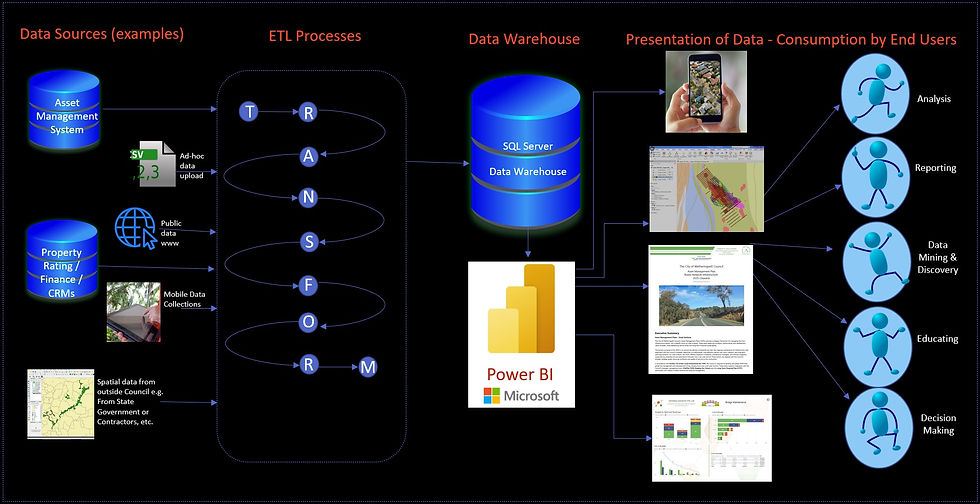
Let’s explore how Power BI connects to different types of data sources and why this matters:
1. On-Premises Databases
Many councils maintain their critical asset data in on-premises databases like Microsoft SQL Server, Oracle, etc. Power BI supports direct connections to these sources via gateways. This means your Power BI Reports can query the most recent data stored within your internal systems without requiring manual exports or data dumps. When configured correctly using an on-premises data gateway, scheduled (or live) refreshes ensure your reports are up to date. This is particularly important for syncing with asset registers, work order systems, or condition inspection results that may all be may be managed in separate systems and databases. The seamless integration allows organisations to modernise their reporting practices while keeping control of sensitive or high-volume data about their own infrastructure assets.
2. Cloud Services
With the shift toward cloud-based enterprise systems, many councils are now using platforms like Microsoft Dynamics 365, Azure SQL Database, SharePoint Online, etc. Power BI’s native connectors make it easy to pull data from these platforms.
For example, you can directly assimilate financial forecasts from Dynamics or access shared documents on SharePoint that track risk assessments, for example. Cloud connections are often simpler to configure and benefit from automatic refresh scheduling, scalability, and secure credential management through services like Azure Active Directory. For your Living Infrastructure Asset Management Plan, this means that even offsite or external data, such as budget approvals or cloud-hosted IoT sensor feeds, can be integrated without additional overhead.
3. APIs and Web Services
In cases where direct database access isn’t feasible, such as vendor systems (TechOne, etc) or SaaS platforms (Dropbox, Adobe, etc), Power BI can retrieve data via APIs.
For example, your council might use a third-party asset inspection platform or condition monitoring system that offers a REST API. Power BI can connect to these APIs using built-in tools like Power Query's Web connector, allowing you to define request parameters, authenticate securely, and transform the returned JSON or XML data into a usable format. This is vital for incorporating data that is frequently updated or uniquely formatted, and it allows for automated extraction of information that would otherwise require cumbersome CSV exports.
4. Files and Spreadsheets
Despite the push toward more centralised systems, Excel and CSV files remain common in local government workflows. Excel spreadsheets have been with us for many years, and I know many people love them and use them in a variety of ways. I know people who still use excel to manually track their maintenance schedules, ratepayers’ feedback, and grant funding applications.
The good news is that Power BI supports live connections to files stored in OneDrive, SharePoint, or even local folders (with gateway support), which means reports can automatically refresh as spreadsheets are updated. This reduces the reliance on static, point-in-time reporting and helps ensure that these ad hoc data sources still contribute meaningfully to the broader asset management picture.
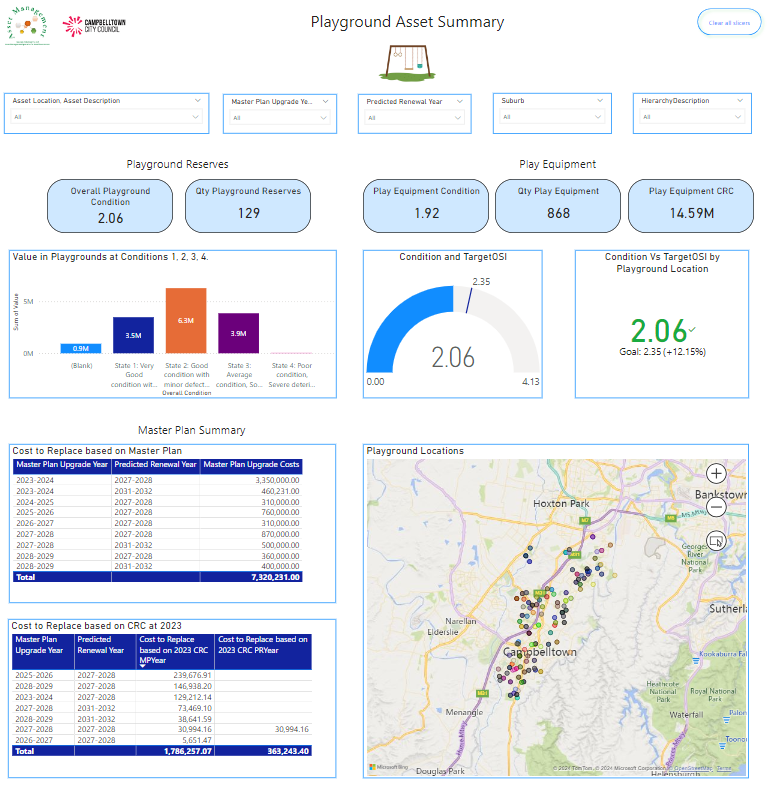
5. Geospatial and GIS Data
For infrastructure asset management, spatial context is critical. Power BI supports integration with GIS platforms such as ArcGIS Online and can also visualise geospatial data by consuming latitude and longitude values from SQL Server tables or by importing custom map boundaries in TopoJSON format. While Power BI does not directly interpret SQL Server's geometry or geography types or shapefiles, these can be pre-processed into supported formats for spatial analysis and mapping.
Visualising asset conditions or risks geographically enables stakeholders to identify patterns. For example, clusters of road defects or stormwater issues, and plan interventions more effectively.
Integrating geospatial data alongside asset condition, financial, and service-level data gives the Living AMP both depth and clarity.
Real-Time Data Refresh and Monitoring
At the heart of a Living Asset Management Plan built in Power BI is the ability to make decisions based on current, reliable data. This is what sets it apart from traditional asset management plans.
Rather than depending on periodic reporting or outdated snapshots, the Power BI Living AMP is dynamic, continuously updating to reflect the true state of infrastructure assets. Power BI enables this through data refresh and monitoring capabilities, allowing users to build Power BI Reports that stay in sync with evolving asset conditions, financials, and service levels in near real time.
1. Scheduled Refreshes - Keeping Your Data Current
For many systems, especially those based on on-premises databases or cloud services, Power BI supports scheduled refreshes. You can configure datasets to refresh at intervals ranging from once a day to multiple times an hour, depending on your Power BI service tier and gateway setup. This ensures that your Power BI Reports reflect recent changes in the data, such as updated condition assessments, newly completed work orders, or financial entries.
This is particularly valuable when reporting to executives or elected members, as you can ensure that figures reflect the current state of affairs without requiring manual intervention.
I love that a weekly report that, in the past, may have taken me a day to prepare can now be produced by a click of a button. Regular reports such as overdue maintenance tasks, upcoming capital works, budget spend, etc, can be generated from always-fresh data.
2. DirectQuery and Live Connections for Real-Time Insight
For systems where up-to-the-minute accuracy is critical, such as operational systems tracking real-time faults, customer complaints, or weather events, Power BI offers DirectQuery and Live Connection modes. Instead of importing data into Power BI, these modes leave the data in the source system and query it live each time a user interacts with a report.
This means there’s no lag between an event happening in the real world (e.g., a pipe burst) and its visibility on a Power BI report. You might use this for integrating live data from a maintenance management platform, or even IoT sensors monitoring asset performance. When an incident occurs, it can immediately show up in the Power BI report, enabling proactive management rather than reactive reporting.
However, it is important to understand the performance and infrastructure implications of using DirectQuery or Live Connections. Each interaction with the report (filtering, slicing, loading a visual) triggers a live query against the source system. This can place significant load on the underlying database, especially if the model is complex or accessed by multiple users. For high-volume or less-performant data sources, this can lead to slow report loading times and potentially degrade the performance of other applications using the same database.
For this reason, DirectQuery and Live Connection should be used selectively, typically when data freshness is critical to decision-making. In most scenarios, a scheduled refresh using imported data provides an efficient and responsive user experience without placing unnecessary strain on the system and this is what I usually recommend to my clients. Always consider your use case, system capacity, and user needs before defaulting to real-time connections.
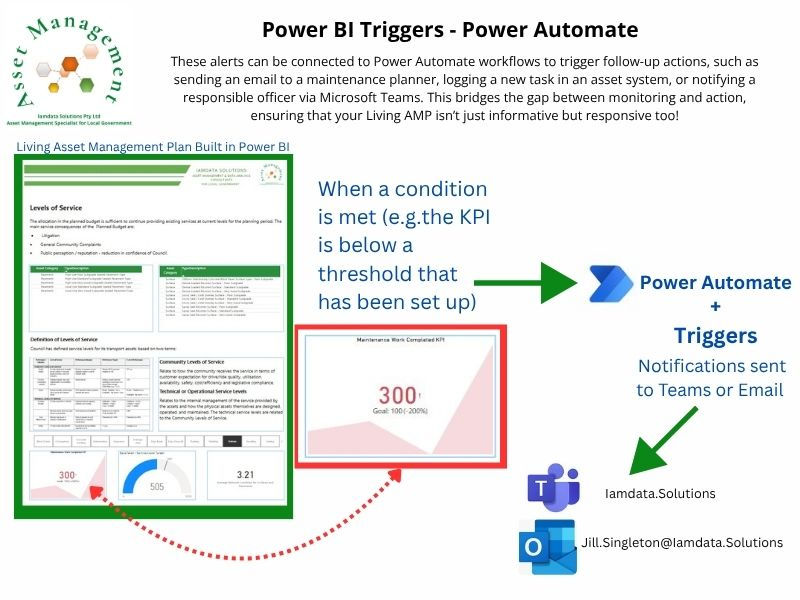
3. Automatic Alerts and Monitoring with Power BI and Power Automate
Beyond just viewing data in a report, Power BI can actively monitor your data for key thresholds or changes. With Power BI data alerts, you can set up automatic notifications when KPIs fall outside expected ranges, for example, if the backlog of reactive work exceeds a set limit or if an asset condition rating drops below a critical level.
These alerts can be connected to Power Automate workflows to trigger follow-up actions, such as sending an email to a maintenance planner, logging a new task in an asset system, or notifying a responsible officer via Microsoft Teams. This bridges the gap between monitoring and action, ensuring that your Living AMP isn’t just informative but responsive too!
4. Streaming Data and Push Datasets Real-Time Event Tracking
For advanced use cases, such as live feed monitoring, Power BI supports streaming datasets and push APIs. These allow you to push data into Power BI from external systems in real time. For example, you could stream location-based data from field crew mobile apps, real-time flood sensor readings, or traffic flow data into Power BI dashboards as it happens.
While this level of integration requires more technical setup (e.g., using Azure Event Hubs or custom APIs), it opens the door to true real-time asset intelligence. For organisations managing critical infrastructure, such as roads, stormwater, water, or power utilities, this capability can be transformative.
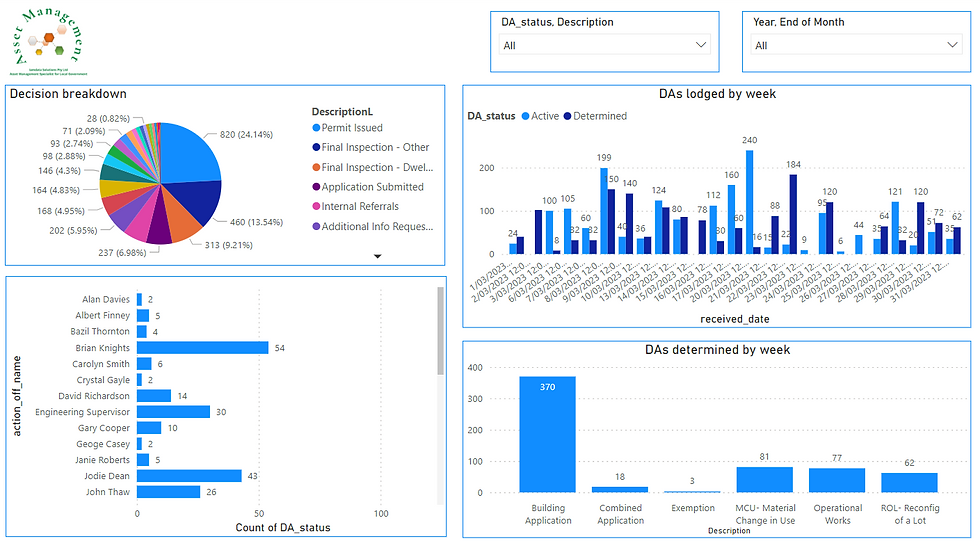
Enhancing Decision-Making Through Integrated Data
The integration of diverse data sources into a single platform enables a holistic view of asset performance.
Being able to combine maintenance records, financial data, and customer feedback together in the same Power BI report can provide insights into asset utilisation, cost-effectiveness, and service quality, and Power BI's data modelling and visualisation tools facilitate the identification of patterns and trends, supporting strategic planning and resource allocation.
Ensuring Data Accuracy and Consistency
For a Living Asset Management Plan to be trusted and useful, the data behind it must be both accurate and consistent. Unlike static reports that offer a snapshot in time, a Living AMP depends on continuous data integration from multiple systems, each with its own format, rules, and potential for error. Without rigorous validation and governance, these differences can lead to incorrect insights, poor decisions, and stakeholder mistrust. Power BI offers a range of tools and practices to ensure that your data is clean, aligned, and fit for purpose.
1. Data Cleaning and Transformation with Power Query
Before data even reaches a Power BI report, it's processed through Power Query, a robust data preparation tool. Power Query allows you to handle issues such as:
Inconsistent formats (e.g. date/time formats, currency fields)
Duplicate or missing records
Null values or invalid entries
Mapping codes to meaningful labels (e.g., 'Status = 3' → 'Completed')
For example, if one system tracks asset condition using a 1–5 scale and another uses ‘Good/Fair/Poor’, Power Query can apply transformation rules to align these values into a unified standard. This ensures you're not comparing apples and oranges when analysing performance or risk.
2. Data Modelling for Semantic Consistency
Power BI’s data model acts as a semantic layer that defines how data from different sources relates to each other. This is critical in asset management, where datasets might use different naming conventions, IDs, or units of measurement.
Relationships are defined between tables (e.g., assets ↔ inspections ↔ costs), ensuring that the right data is linked and aggregated correctly.
Calculated columns and measures provide standardised definitions of key metrics such as ‘Total Annual Maintenance Cost’ or ‘Asset Condition Index’ so everyone in the organisation is working from the same version of the truth.
A well-designed model eliminates confusion and makes it easier to slice and drill into asset data without accidentally introducing bias or errors.
3. Validation Rules and Reference Data
To keep inputs aligned across systems, many councils maintain reference tables or lookup lists such as asset types, condition rating definitions, or priority codes. Power BI allows you to link these reference datasets directly to operational data to flag mismatches, anomalies, or outdated entries.
You can also build validation pages in your Power BI reports that shows:
Records missing required fields
Assets without recent condition assessments
Discrepancies between system totals (e.g., financial vs. operational)
This gives asset managers a proactive way to maintain data cleanliness and avoid rubbish-in, rubbish-out situations.
4. Data Governance and Source Accountability
A Living AMP thrives when data flows from clearly defined and governed sources. Power BI makes it easier to trace where data comes from and who owns it by:
Documenting data source paths in the dataset settings
Using dataflows to centralise and standardise ETL logic
Enabling dataset certifications to highlight trustworthy, validated models
This creates a culture of accountability. Finance owns the budget data, Operations owns maintenance data, GIS owns location data, and all of it converges in one clean, governed model.
5. Testing, Review, and Feedback Loops
Finally, maintaining accuracy is an ongoing process. Power BI makes it easy to create testing environments, sandbox reports, or QA pages where internal users can spot anomalies before publishing dashboards to wider audiences. Engaging with frontline staff and system admins helps validate both the data and how it's being interpreted.
This continuous feedback loop is crucial for evolving your Living AMP with confidence and credibility.
Without accuracy and consistency, a Living AMP quickly becomes a misleading AMP. Power BI provides the tools not just to visualise data, but to transform, validate, standardise, and govern it across its entire lifecycle. Getting this right means that decisions about renewals, risks, resourcing, etc are grounded in real-world, reliable evidence.
From Static to Strategic and Realising your Living AMP Vision!
Transforming a static asset management plan into a living, dynamic tool is no longer a distant goal. It is entirely achievable with the right approach and technology. Power BI’s powerful data connectivity and integration capabilities make it possible to unify information from all council departments and systems, as well as third party data, such as weather data, demographic data, etc. This enables councils to monitor infrastructure health, track service performance, and respond proactively to emerging issues, all within a single, interactive platform.
But making this shift is not just about using new software. It is about rethinking how asset data can support better decisions, more transparency, and smarter long-term investment. I understand the complexities that councils face when dealing with siloed data, legacy systems, and evolving reporting needs, and I would like to let you know that I am here to help guide you through that journey. Please reach out if you’d like to have a chat jill.singleton@iamdata.solutions I’d love to hear from you.
Whether your council is just starting with Power BI or you are looking to take your Asset Management to the next level, I can work with you to design a solution that is tailored to your council’s needs, data maturity, and strategic goals.

I have worked on many different projects with my Local Government clients, from designing and developing Power BI Reports, to building SQL Server databases for spatial data, to managing and maintaining GIS and the Asset Management systems. If you'd like to discuss how we might work together, then please email Jill at ➡️ jill.singleton@iamdata.solutions
If you would like to receive the latest Newsletter Blog straight to your inbox, please subscribe here: ➡️ https://www.iamdata.solutions/subscribe
You can read all our Newsletters and Blogs here:➡️ https://www.iamdata.solutions/blog
You may also be interested in our Projects Page:➡️ https://www.iamdata.solutions/past-projects
Check out what our clients say about us here:➡️ https://www.iamdata.solutions/reviews
If you would like to see a particular topic covered in these newsletters, then please let me know about it. The chances are other people will be interested and would like to hear about it too! Please email me at: ➡️ jill.singleton@iamdata.solutions with your suggestions.


Comments