
Using Power BI to Strengthen Communication and Community Engagement in Councils 🎙️📈
- Jill Singleton

- Jan 29
- 6 min read
Updated: Jan 30
If you've ever worked at the council then you understand that community engagement sits at the heart of an effective local government. When residents feel heard, understood, and informed, trust grows. Participation increases, and council decisions are far more likely to reflect real community needs.
But, as we know, councils face a very real challenge.
They collect a lot of community data: survey responses, consultation submissions, service requests, demographic insights, social feedback, yet much of this information ends up locked away in spreadsheets or lengthy PDF reports that few people read.
So how do councils cut through the noise and turn all that data into something meaningful?
One of the most powerful (and still underutilised) tools is Microsoft Power BI.

Welcome to the Iamdata Solutions Asset Management Newsletter – February 2026
The Engagement Challenge
Councils are data-rich but often insight-poor. Raw data on its own rarely engages anyone internally or externally. In fact, it often overwhelms both staff and the community. Long reports, static charts, and outdated PDFs are not renowned for inviting questions or conversation. This is where I believe Power BI makes a real difference.
Transforming Data into Dialogue
Power BI allows councils to turn complex datasets into clear, interactive, visual stories that are easy to understand and easy to explore.
Instead of telling the community what happened, councils can now show them with Power BI, and even let people interact with the information themselves. Power BI reports can be:
Embedded on council websites
Used live in community workshops
Shared with Councillors and Executives
Embedded directly into Microsoft Teams for staff collaboration
Suddenly, data becomes a conversation starter, not just a compliance exercise.
1. Transparent Reporting Builds Trust
Residents consistently want answers to simple but important questions:
Where is council money being spent?
What’s happening with local projects?
What changed as a result of community feedback?
Power BI allows councils to move beyond static annual reports and publish live, interactive Power BI reports that show:
Budget allocation and spend
Capital works progress
Consultation participation
Outcomes linked directly to community input
Because Power BI reports refresh automatically from source systems, the information stays current without the need for staff to continually having to manually update spreadsheets or reissue PDFs.
How to get started
Identify one high-interest topic (e.g. capital works, parks upgrades, community safety)
Build a simple Power BI report with 5–7 key visuals
Publish it to Power BI Service
Embed it on your website using secure public or authenticated access
Even one transparent dashboard can dramatically improve trust.
2. Identifying Trends & Gaps in Engagement
We can use Power BI for internal reporting as well as public reporting. By combining data from:
Community surveys
Event attendance lists
CRM or request systems
Demographic datasets
Councils can start answering important questions:
Which suburbs are underrepresented in consultations?
Which age groups are not engaging?
When do response rates peak or drop?
Which engagement methods actually work?
How to implement this
Bring engagement data into a single reporting model
Use maps to visualise participation by suburb
Track engagement over time, not just per project
Share insights with communications and community development teams
This allows councils to design more inclusive and targeted engagement strategies, rather than relying on guesswork.
3. Cross-Council Communication with Power BI in Microsoft Teams
Community engagement never belongs to one team. Customer Service, Planning, Infrastructure, Parks, Finance, and Executives all need access to the same information quickly and in context. Too often, this handover relies on emails, attachments, and outdated reports. Sharing Power BI reports inside Microsoft Teams changes this completely.
By embedding live Power BI reports directly into Teams channels, councils create a single source of truth where:
Everyone sees the same data
Reports update automatically
Conversations happen around the data itself
Staff can:
Discuss trends using comments
@mention colleagues to assign follow-ups
Filter data live during meetings
Keep decisions documented alongside the data
Instead of asking, ‘is this the latest spreadsheet?’ (Which is probably the scariest sentence anyone has ever said to me! 😱), teams can focus all their attention on action.
4. Community Consultation Feedback at a Glance
After a consultation closes, how results are presented matters. Power BI allows councils to replace long summary documents with:
Interactive charts
Filters by age group, suburb, or topic
Maps showing geographic patterns
Clear summaries of key themes and sentiment
This approach benefits both staff and the community. Residents can see how their views compare with others, and council officers can quickly interpret results without wading through pages of text.Imagine a council running a survey on local park upgrades. Instead of publishing a PDF summary, they:
Create an interactive map showing which parks received the most feedback
Visualise preferred improvements (lighting, dog areas, playgrounds)
Break down responses by demographic group
Embed the report on the consultation webpage
Use the same report in a community workshop
The data is not static, it is a shared conversation.
Power BI Visual Patterns That Work for Community Engagement
Many councils already use Power BI for asset management, capital works, and service planning. The good news is that the same visual patterns work perfectly for engagement data. To show what is possible with Power BI in a community engagement context, here are some examples drawn from my Power BI Reports examples.
Similar reports to these examples are currently being used for asset management, capital works and service planning, and the same visual patterns can be repurposed for community engagement data.
Example 1 – Executive Summary with Interactive Map
This Capital Works Programs Report shows how councils can summarise complex datasets into a single, intuitive view with KPIs, trend charts and spatial mapping.
A similar condensed layout will work well for community engagement, taking into consideration sentiment and response volumes from survey participation rates, as well as asset condition.

Example 2 – Trend Analysis & Participation Over Time
In the Water Quality Power BI reports, I can track performance trends over time to inform strategic decisions.
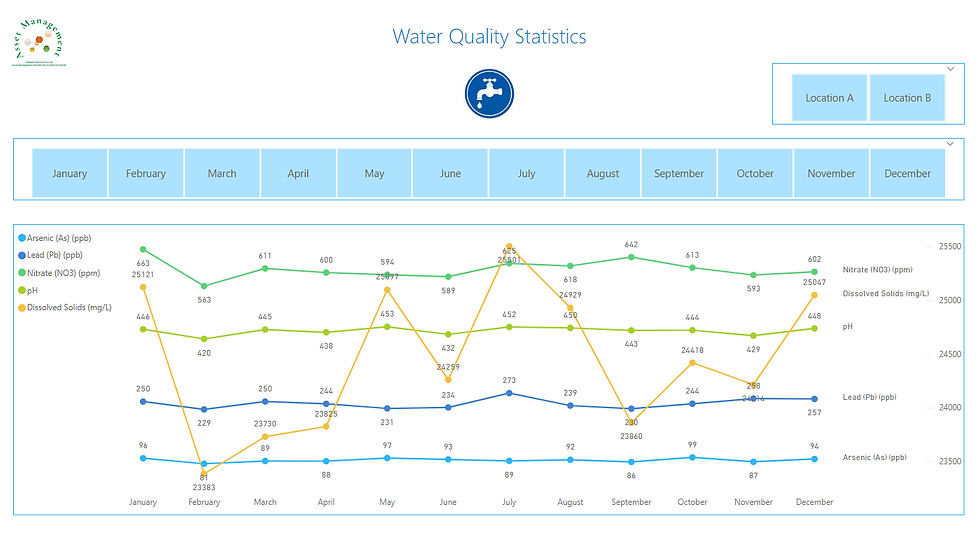
A similar visual could be applied to:
Monthly consultation activity
Year-on-year response growth
Engagement campaign performance
Example 3 – Feedback Themes & Sentiment Breakdown
For community engagement, this becomes a powerful way to visualise:
What residents are talking about most
Which issues generate negative sentiment
How feedback differs across suburbs or age groups

Example 4 – From Community Voice to Council Action
One of the strongest accountability tools is showing how feedback flows into delivery.
This workflow-style layout can be adapted to track:
Feedback → Prioritised → Funded → Completed
Example 5 – Funding Alignment by Suburb
This Power BI reports demonstrate where money is being spent.
This same approach can enable councils to transparently show:
Which suburbs raised the most concerns
Where funding was allocated in response
Gaps between community expectations and budget reality

Why These Power BI Visuals Matter
These reports demonstrate that councils are:
Listening
Acting
Delivering
By reusing proven Power BI design patterns, councils can turn engagement into a living, transparent accountability framework not a once-off exercise.
Transparent Governance, Informed Communities
Power BI represents more than a reporting tool. It is a bridge between councils and the communities they serve. By transforming complex operational and financial data into intuitive, interactive Power BI reports, councils can shift from static reporting to dynamic conversations. Residents gain the ability to explore local initiatives, trace funding decisions, and witness the tangible outcomes of council programs in their localities.
This transparency cultivates what matters most, trust, informed local participation, and sustained community confidence. Whether monitoring community sentiment, assessing program effectiveness, or deepening your understanding of fundamental needs, Power BI delivers the clarity and adaptability that modern council leadership demands.
If you're unsure where to start, I'm always happy to have a conversation. Please feel free to reach out.

I have worked on many different projects with my Local Government clients, from designing and developing Power BI Reports, to building SQL Server databases for spatial data, to managing and maintaining GIS and the Asset Management systems. If you'd like to discuss how we might work together, then please email Jill at ➡️ jill.singleton@iamdata.solutions
If you would like to receive the latest Newsletter Blog straight to your inbox, please subscribe here: ➡️ https://www.iamdata.solutions/subscribe
You can read all our Newsletters and Blogs here:➡️ https://www.iamdata.solutions/blog
You may also be interested in our Projects Page:➡️ https://www.iamdata.solutions/past-projects
Check out what our clients say about us here:➡️ https://www.iamdata.solutions/reviews
If you would like to see a particular topic covered in these newsletters, then please let me know about it. The chances are other people will be interested and would like to hear about it too! Please email me at: ➡️ jill.singleton@iamdata.solutions with your suggestions.


Comments