
The Hidden Cost of Dirty Data 💩📊🛁📈💸
- Jill Singleton

- Jan 2
- 6 min read
Updated: Jan 3
Accurate data isn’t just helpful it is crucial. Yet, across many councils and other local government organisations, we often encounter asset registers riddled with inconsistencies, missing values, duplicate records, or outdated information. This ‘dirty data’ quietly erodes the effectiveness of your systems, your confidence in reporting, and ultimately, your ability to make informed decisions.
So, what’s the real cost of unclean asset data, and what can you do about it?

Welcome to the Iamdata Solutions Asset Management Newsletter – January 2026
Why Dirty Data Happens
Asset data typically accumulates from multiple sources over many years from legacy systems, manual inputs, spreadsheets, or field crews using inconsistent naming conventions. Over time, small errors multiply:
Assets with no location or an incorrect location.
Attributes recorded in the wrong format.
Incomplete maintenance histories.
Duplicate entries for the same asset.
Without active data management practices, these issues persist and compound.
The Impact of Bad Data is More Than Just an Inconvenience
Dirty data has very real, often hidden, costs:
1. Poor Decision-Making
When you're basing decisions on unreliable data, even the best dashboards and reports become misleading. You might:
Over invest in assets that do not exist.
Miss critical interventions because risk profiles are wrong.
Misreport to stakeholders or auditors.
2. Inefficient Operations
Staff spend unnecessary time manually correcting or cross-referencing information. It slows down everyday tasks like:
Preparing capital works programs.
Responding to service requests.
Conducting field inspections.
3. Regulatory Risk
Inaccurate data can lead to non-compliance with reporting standards, especially when financial or safety-related decisions rely on asset records.
4. Wasted Budget
Imagine budgeting for 100 footpath segments when only 80 segments actually exist on the ground, or missing 20 segments elsewhere that requires maintenance. Dirty data directly undermines budget accuracy and strategic planning.
What Clean Data Looks Like
Clean data is:
Accurate
Consistent
Complete
Timely
Structured
Good clean data gives you confidence. You know that when a report says 93% of your roads have been inspected this year, that number reflects the real world.
What You Can Do To Ensure You Keep Your Data Clean?
If you're working in local government or managing assets for a utility, here’s how to tackle the problem:
1. Audit Your Asset Register
Start with a structured review of your data. Identify blanks, inconsistencies, and duplicates. We often use Power BI for this step it is great for profiling your data at scale.
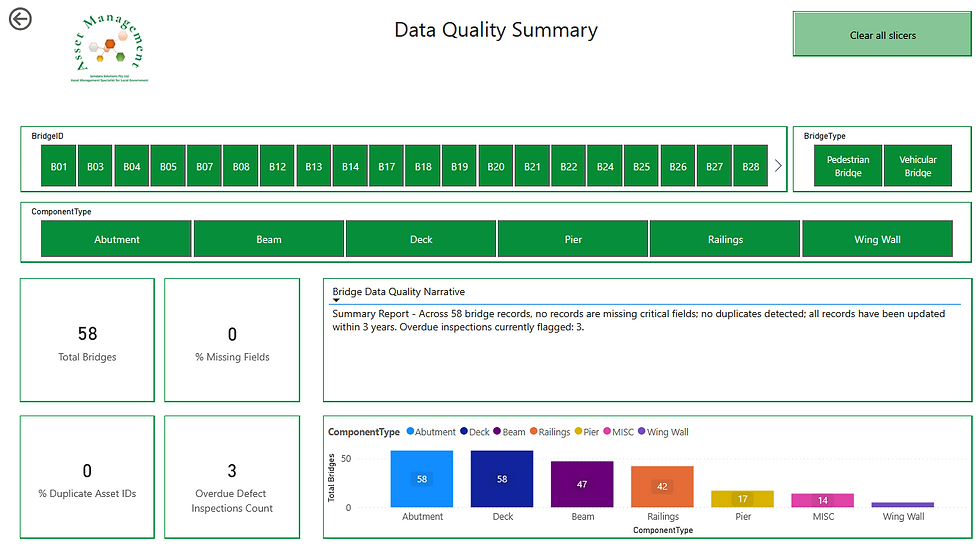
For example, the Data Quality Summary Power BI report above is designed to bring to light data anomalies quickly and drive corrections back to the source systems (not just patch them in Power BI!)
Here is how a Data Quality Power BI Report helps you identify problems and fix them at the root.
1a. Executive-level health indicators to identify red flags instantly
The KPI cards provide a live snapshot of systemic data quality:
Indicator | What it detects | How it drives fixes |
% Missing Fields | Assets missing mandatory attributes (e.g. inspection date, component type, condition score) | Highlights gaps in field capture forms, validation rules, or integration mappings in Asset Vision / Confirm / GIS |
% Duplicate Asset IDs | Duplicate BridgeID / Component IDs | Flags broken key generation logic, manual ID creation, or failed de-duplication rules in source systems |
Overdue Defect Inspections | Assets past inspection cycle | Exposes breakdowns in inspection workflows, scheduling rules, or mobile data sync failures |
This means you are not guessing where problems are the KPIs quantify the scale of each issue.
1b. Slicer-driven root-cause isolation
You can slice the report by:
BridgeID
BridgeType (Pedestrian / Vehicular)
ComponentType (Abutment, Beam, Deck, Pier, Railings, Wing Wall)
This allows you to immediately answer:
Is the problem concentrated on a single bridge?
Does one component type (e.g. Decks) have more missing data?
Are pedestrian bridges being inspected less reliably?
That moves the conversation from:
‘Is our data is correct?’ to ‘Deck components on vehicular bridges are missing condition data, we need to fix this’.
1c. Component coverage analysis showing structural blind spots
The bar chart showing Total Bridges by ComponentType reveals data imbalance:
Component | Example Insight |
Abutment / Deck = 58 | Full coverage as expected |
Beam = 47 | We can see at a glance the components of each bridge. While not all bridges have all components, it is easy to see what each individual bridge has. |
Pier = 17 | |
Wing Wall = 14 |
This can also immediately expose instances of:
Missing component creation in the asset register
Inconsistent component classification rules
Technicians bypassing controlled vocabularies
1d. Narrative insight - an automated anomaly explanation in plain English
The Bridge Data Quality Narrative converts raw metrics into plain English:
‘Across 58 bridge records, no records are missing critical fields; no duplicates detected; all records updated within 3 years. Overdue inspections currently flagged: 3’.
This is powerful because it:
Automatically flags exceptions only
Can be placed in management dashboards
Makes data quality measurable and auditable
It creates accountability and the business can no longer ignore quality problems hidden in tables.
1e. Fixing errors at source - the real value
Every anomaly type maps to a system-level fix:
Anomaly | Root Cause | Fix at Source |
Missing fields | Optional fields in AMS forms | Make fields mandatory in Asset Management forms |
Duplicate IDs | Manual ID creation or bad import logic | Enforce ID generation rules in SQL / AMS |
Missing components | Poor segmentation or component creation process | Automate component creation from CAD, GIS or templates |
Overdue inspections | Broken inspection scheduling | Fix inspection cycle logic & mobile sync rules |
Component imbalance | Uncontrolled free-text values | Replace with controlled lookup tables |
1f. Outcome: a closed-loop data quality system
This report serves as a control mechanism to ensure your data is well maintained by providing the means for you to:
Detect anomalies in Power BI
Isolate where and why they occur
Fix validation rules, workflows and integrations in source systems
Re-load data and confirm the anomaly is gone
That is how you move from reactive reporting to a self-healing asset data ecosystem, which is exactly what a Living Asset Management Plan should deliver.
2. Define Your Standards
Set clear data definitions and standards: what does a 'complete' record look like for a road, tree, or building?
3. Cleanse and Validate
Use tools and scripts (or external expertise) to batch-clean your data. Validate against field data, GIS layers, or original plans where possible.
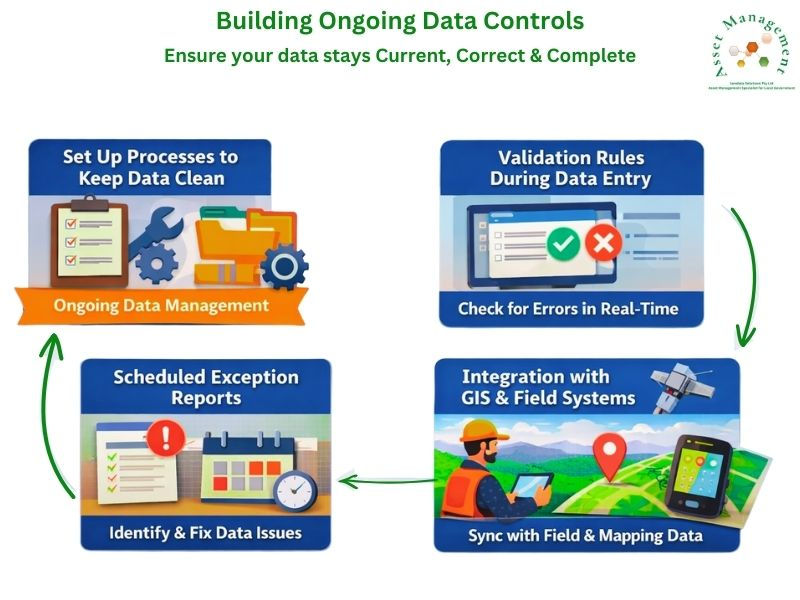
4. Build Ongoing Controls
Set up processes to keep your data clean going forward. For example:
Validation rules during data entry.
Scheduled exception reports.
Integration with GIS and field systems.
My Experience
I’ve helped councils across Australia clean up their asset data.
Often, the first step can be as simple as building a custom Power BI report that surfaces anomalies, gaps in inspection dates, duplicate asset IDs, missing GIS coordinates, and more.
By combining data cleansing with better reporting and planning tools, I've helped many organisations move from reactive to strategic asset management.
Final Thoughts
Dirty data might not grab headlines, but it’s a silent killer of productivity and planning. Investing in data cleansing isn’t just a technical fix it’s a strategic move that pays dividends across your entire organisation.
If you're unsure where to start, I'm always happy to have a conversation. Clean data leads to clear decisions and better outcomes for your community.

I have worked on many different projects with my Local Government clients, from designing and developing Power BI Reports, to building SQL Server databases for spatial data, to managing and maintaining GIS and the Asset Management systems. If you'd like to discuss how we might work together, then please email Jill at ➡️ jill.singleton@iamdata.solutions
If you would like to receive the latest Newsletter Blog straight to your inbox, please subscribe here: ➡️ https://www.iamdata.solutions/subscribe
You can read all our Newsletters and Blogs here:➡️ https://www.iamdata.solutions/blog
You may also be interested in our Projects Page:➡️ https://www.iamdata.solutions/past-projects
Check out what our clients say about us here:➡️ https://www.iamdata.solutions/reviews
If you would like to see a particular topic covered in these newsletters, then please let me know about it. The chances are other people will be interested and would like to hear about it too! Please email me at: ➡️ jill.singleton@iamdata.solutions with your suggestions.


Comments