
Methodology for Measuring Asset Capacity and Asset Utilisation in Local Government Infrastructure Asset Management
- Jill Singleton
- Jul 27, 2025
- 6 min read
Updated: Jul 30, 2025
As you know, in local government, we manage a wide variety of assets all of which play a critical role in supporting our communities. But how do we know if these assets are performing as they should?
This month’s blog, I’ll be diving into two key metrics that can help councils get clearer answers. Asset Capacity (what an asset can deliver) and Asset Utilisation (how much of that capacity is actually being used).
By understanding and tracking these measures, councils can make smarter decisions about maintenance, renewals, and capital planning and ultimately deliver services more efficiently and effectively.

Welcome to the Iamdata Solutions Asset Management Newsletter - August 2025
Asset Capacity & Asset Utilisation in Asset Management
When councils understand and measure these metrics they are able to align asset supply with community needs, identify both underused and overburdened assets, and make more informed decisions about maintenance, renewal, and capital investments. These measures also support regulatory compliance and financial reporting obligations.
Measuring Asset Capacity
Asset capacity refers to the maximum output or service that an asset can provide under normal operating conditions.

The definition of capacity varies by asset type. For example, the capacity of a community centre may be defined by the number of people it can safely accommodate, while in water infrastructure capacity might mean the volume a reservoir or pipeline can deliver.
The capacity of a road often relates to the maximum volume of traffic it can support. Most councils adopt a road hierarchy based on function, purpose, and usage intensity. These categories usually include these definitions, which can help us understand the capacity associated with each road type:
Arterial Roads - Major roads that carry large volumes of through traffic across urban or regional areas. They connect towns, suburbs, or major activity centres and often include state-managed highways.
Sub-arterial / Distributor Roads - Roads that distribute traffic between arterial roads and local streets. They carry moderate traffic and often link key urban zones, industrial areas, or rural districts.
Collector Roads - Roads that collect traffic from local streets and funnel it towards distributor or arterial roads. These roads serve both traffic movement and property access.
Local Roads - Roads that primarily provide direct access to properties, residential areas, and local destinations. These have lower volumes and speed limits.
Access Lanes / Service Roads - Minor roads or lanes used for service access, rear access, or pedestrian-focused environments. Usage is often limited and capacity requirements are low.
As I mentioned before, capacity does vary with each asset type, but as a start, we can begin with a review of design specifications, as-built drawings and documentation. For buildings, the building occupancy certificates would be good source of information, and engineering plans would be useful for assets like roads, etc. This type of information provides a theoretical maximum that is then adjusted based on the current condition and / or the material of the asset. There may be other factors that affect the capacity, for example if a part of a building is temporarily closed for repairs, the functional capacity is reduced accordingly. Compliance with current regulations, such as updated safety codes or health requirements, may also further affect usable capacity.
Some councils use performance modelling tools to assess capacity, especially for assets like water networks or roads. These tools analyse real-world performance data to estimate what an asset can currently deliver, taking into account age and wear.
Councils also often refer to service level agreements and community benchmarks that define capacity in terms of desired outcomes, such as having a playground within a certain distance of all residents.
Measuring Asset Utilisation
Asset utilisation measures the extent to which an asset’s available capacity is being used over a specified period. This is often expressed as a percentage or a rate of use and can help identify both unmet demand and inefficiencies in asset provision. Councils use several methods to gather utilisation data.
I've used Road Assets in my example flowchart below:
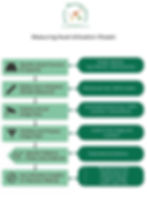
Manual methods of gathering utilisation information could include things like regular headcounts or logbooks for facilities such as libraries, pools, or meeting rooms. Increasingly, councils are turning to automated solutions such as people counters, vehicle sensors, or access card logs that capture usage data without the need for staff presence. Booking systems provide another valuable data source, especially for assets like sports fields or community halls, where use is managed by reservations. The rise of smart technology has enabled some councils to collect real-time usage data from occupancy sensors and other ‘Internet of Things’ devices.

After data is collected, councils can analyse utilisation by comparing observed use against capacity. This analysis is often normalised over relevant periods, such as daily or seasonal peaks. Metrics such as average daily utilisation rates or percentage of time an asset is in use help to build a clear picture of asset performance. Many councils also benchmark utilisation rates against those of similar organisations or use spatial analysis in a GIS to identify geographic areas where supply does not meet demand.
Community engagement through surveys and feedback can also reveal insights into perceived access or barriers to use that might not be captured by usage data alone.
Integrating Capacity and Utilisation in Asset Management
Councils that integrate capacity and utilisation measures into their asset management systems gain valuable insights for both strategic and operational planning. Asset Management Plans rely on this data to forecast future needs, support funding bids, and guide maintenance and renewal strategies.
Assets that are heavily used may be prioritised for upgrades or expansion. The analysis and map below shows the roads that are coming up for renewal and where the data is telling us they are over capacity, more and heavier traffic are using these roads than they were initially designed to take.
This is the ideal time to think about replacing the inefficient road design with a design that aligns with the traffic requirement.


It is also true, with this analysis that decision makers can identify assets that are consistently underutilised and consider options such as repurposing, consolidation, or disposal.

Councils are required to report on their asset performance as part of state government regulatory requirements. This often includes reporting on community infrastructure levels, asset sustainability indicators, and service delivery performance. Advances in technology have enabled councils to use enterprise asset management systems, GIS, and business intelligence platforms like Power BI to bring together data on capacity, utilisation, asset condition, and finances in one place, making analysis and reporting more efficient and effective.
What are the Challenges and Considerations when Integrating Capacity and Utilisation in Asset Management?
Measuring asset capacity and utilisation is not without challenges. Obtaining reliable and consistent utilisation data can be difficult, especially for assets that are not staffed or do not have automated monitoring systems. The resources required to install and maintain these systems can be significant, particularly for councils with large and diverse asset portfolios. Changing community needs and unexpected events, such as demographic shifts or health crises, can cause rapid changes in utilisation patterns that are difficult to anticipate or track.
Privacy and ethical considerations also arise when collecting usage data, particularly where sensors or monitoring technology are involved. Councils must ensure compliance with privacy laws and balance data collection needs with community expectations for privacy.
Optimising Service Delivery Through Understanding Asset Capacity and Utilisation in Asset Management
To sum up, understanding and measuring asset capacity and utilisation supports smarter, data-driven asset management. Councils can improve service delivery by applying a consistent and well-rounded approach.
Key takeaways:
Use a combination of design standards, condition assessments, and usage monitoring.
Leverage technology (e.g. IoT, GIS, Power BI) to enhance data accuracy and insight.
Incorporate community feedback to understand perceived access and demand.
Adapt methodologies to suit different asset types and resourcing levels.
Commit to ongoing improvement in data collection, integration, and analysis.
This approach helps councils make confident, transparent decisions and optimise infrastructure investment.
Asset Capacity and Asset Utilisation References and Further Reading
References for further study include the Institute of Public Works Engineering Australasia (IPWEA) Practice Notes, the ISO 55000 Series on Asset Management, the Australian Local Government Association’s National State of the Assets Report, and state-specific local government financial and performance reporting requirements.
As always, I’d love to hear your thoughts or experiences on how your council is tackling this.

I have worked on many different projects with my Local Government clients, from designing and developing Power BI Reports, to building SQL Server databases for spatial data, to managing and maintaining GIS and the Asset Management systems. If you'd like to discuss how we might work together, then please email Jill at ➡️ jill.singleton@iamdata.solutions
If you would like to receive the latest Newsletter Blog straight to your inbox, please subscribe here: ➡️ https://www.iamdata.solutions/subscribe
You can read all our Newsletters and Blogs here:➡️ https://www.iamdata.solutions/blog
You may also be interested in our Projects Page:➡️ https://www.iamdata.solutions/past-projects
Check out what our clients say about us here:➡️ https://www.iamdata.solutions/reviews
If you would like to see a particular topic covered in these newsletters, then please let me know about it. The chances are other people will be interested and would like to hear about it too! Please email me at: ➡️ jill.singleton@iamdata.solutions with your suggestions.