
Gippsland Ports - Power BI Customer Feedback Management Report Case Study
- Jill Singleton

- Apr 29
- 12 min read
I recently had the pleasure of working with Gippsland Ports to develop and build a comprehensive Power BI report to transform the way their team manages and reports on community feedback. It was a very interesting project to work on, and it was great working with the team at Gippsland Ports. I wanted to share this case study as it is a great example of how Power BI can tell a much clearer story and genuinely support better decision making.
Welcome to the Iamdata Solutions Asset Management Newsletter – May 2026
1. Client Background
Gippsland Ports is the waterway management authority for five local ports and four waterways in the wider Gippsland coastal region in Victoria, Australia. The authority manages a diverse portfolio of responsibilities including port operations, navigation safety, asset maintenance, waterway compliance, berth and mooring management, and community engagement across multiple regions stretching from Inverloch in the West to Mallacoota in the far East. This includes two major local ports of Gippsland Lakes and Corner Inlet & Port Albert.
As a public authority, Gippsland Ports is accountable to the Department of Transport and Planning through its Board. Community members, boaters, commercial operators, and other stakeholders regularly submit feedback covering a wide range of issues from infrastructure maintenance requests and navigation hazards through to waterway compliance matters, environmental concerns, and general inquiries.
Gippsland Ports uses Asset Vision, a purpose-built asset management software platform, to manage and record all aspects of its operational activities including community feedback, job management, inspections, and asset maintenance. Asset Vision is the source of truth for all feedback data within the organisation. To enable reporting and integration with other systems, Gippsland Ports has established an Azure SQL Server environment that automatically replicates the raw Asset Vision tables into a cloud-hosted database. This architecture keeps the Azure SQL Server continuously synchronised with the live Asset Vision data without any manual intervention.
The Power BI report built during this engagement connects directly to this Azure SQL Server, meaning every time the report is refreshed it draws the latest data from the replicated Asset Vision tables giving the Board and operations team an accurate, up-to-date view of feedback performance without any manual data extraction or spreadsheet preparation.
2. The Challenge
Gippsland Ports faced several interconnected data and reporting challenges that this engagement was commissioned to address.
Complex Source Data Structure
The Asset Vision System stores feedback data in a highly normalised database structure. Key fields including customer contact details, feedback descriptions, location information, category classifications, and resolution actions were stored as individual rows in a generic FormField table rather than as dedicated columns making direct reporting difficult without significant data transformation.
The source database contained four primary tables FormField (30,000+ rows), Module (1,459 records), Job (241 records), and WorkflowStatus (1,836 records) each with complex relationships that needed to be understood, documented, and correctly modelled before any reporting could be built.
Board-Ready Reporting
While feedback performance was being reported to the Board, the process relied heavily on manual effort and was difficult for staff to sustain over time. Teams were required to extract raw data from the Asset Vision System into spreadsheets and then manually build charts and graphs for each reporting cycle.
This approach was not only time-consuming but also placed considerable pressure on staff, particularly when trying to ensure accuracy and consistency under tight timeframes.
A key challenge was that once data was extracted, it immediately began to lose its currency. Any feedback items logged, updated, or closed after that point were not reflected in the report. This meant staff were often working with information that no longer fully represented the current state of operations.
Without a clear, real-time view of the data, it was difficult for staff to confidently interpret what the data was telling them, identify emerging trends, or clearly communicate insights to the Board.
Backlog Visibility
The reliance on periodic manual extracts also made it challenging to maintain a clear and consistent view of outstanding feedback items. There was no central, real-time way for staff to see how many items were being carried forward or where pressure was building across the organisation.
As a result, unresolved items could accumulate between reporting periods without being fully visible. It was often only at the point of the next extract that the true extent of the backlog became apparent by which time it may have already grown further.
This lack of visibility made it difficult for management and staff alike to:
clearly understand the scale and movement of the backlog
identify patterns across categories, regions, or teams
proactively respond to resourcing pressures
confidently track progress against resolution targets
For staff on the ground, this also meant limited ability to step back and see the bigger picture. Without a holistic view of the data, it was harder to connect day-to-day work with broader organisational performance and priorities.
Narrative Reporting Requirements
The Feedback report required plain-language narrative summaries alongside data visuals, not just numbers but written interpretations that could be included directly in Board papers without manual drafting. These summaries needed to update automatically based on filter selections so that region-specific or period-specific narratives could be generated instantly without manual editing.
Gippsland Ports needed to move from raw data stored in a complex database structure to a self-service reporting tool that any team member could navigate without prior technical expertise.
3. The Solution
Iamdata Solutions designed and built a comprehensive four-page Power BI report connected directly to the Asset Vision Feedback System Azure SQL Server database. The solution encompassed SQL query development, Power BI data modelling, DAX measure development, report design across four specialised pages, and complete end-user documentation.
SQL Data Extraction Layer
The foundation of the solution was a set of SQL queries that extracted, transformed, and shaped the raw database tables into a clean, report-ready dataset. The primary query joined the Module table with a pivoted FormField subquery using a Common Table Expression (CTE), converting the row-per-field structure of the FormField table into a single row per feedback record with each field as a dedicated column.
Derived columns were calculated directly in SQL to maximise Power BI performance: Age in Days (days from creation to completion or to today for open items), Age Bracket classification, Status (Open or Closed), Year, Quarter, Half Year, and a formatted Year-Month field with a numeric sort column for correct chronological ordering. This approach reduced the computational load on Power BI and ensured consistent values regardless of when the report was refreshed.
Separate SQL queries were developed for the WorkflowStatus table, producing both a latest-status-per-record view for current workflow reporting and a full history view for timeline and audit trail visuals.
Power BI Data Model
The Power BI data model was designed around three core tables: Feedback (the primary fact table), FormField, and WorkflowStatus, with clearly defined relationships. The model used both active and inactive relationships to enable the WorkflowStatus table to link to Feedback via a USERELATIONSHIP DAX function, allowing closed items to be plotted against their completion date while new items plotted against their creation date on the same time axis.
A calculated column approach was used for row-level derivations such as Age Bracket, Status, and Brought Forward information ensuring these values were computed at data load time rather than recalculated on every visual render, improving the Power BI Report responsiveness.
DAX Measure Library
A library of DAX measures was developed covering volume metrics, performance ratios, time intelligence calculations, and plain-language narrative labels. Key measures included:
Measure | Purpose |
New Items | Count of all feedback records in the current filter context. |
Open Items | Count of records with no Completed Date. |
Closed Items | Count of records with a Completed Date recorded. |
Close Rate % | Ratio of closed to new items expressed as a percentage. |
Avg Duration Days | Mean days from creation to closure for closed items only. |
Median Close Days | Median closure duration, less sensitive to outliers than the average. |
Closed Within 7 Days % | Proportion of closed items resolved within one week. |
Backlog Growth | Net change in open items compared to the same point last year, returned as a plain-language sentence. |
Backlog Growth % | Year-on-year percentage change in open items, with directional language (increased/decreased). |
New Items Previous Year | Prior year volume for year-on-year comparison. |
Items B/F Previous Period | Count of open items created before the selected period. |
Cumulative Open Items | Running total of open items accumulating across time periods, unaffected by region or department filters. |
All percentage measures were developed with companion label versions that format values correctly for display (e.g. 73% rather than 0.73) and incorporate directional plain-language where appropriate (e.g. the backlog increased by 69 items compared with last year).
Four-Page Report Design
The report was structured across four pages, each serving a distinct purpose for different audiences and use cases.
Page 1 - Feedback Summary

The executive summary page provides a complete operational overview in a single view. Five KPI cards display New Items, Closed Items, Open Items, Close Rate, and Average Duration Days. Two matrix visuals show feedback volumes by region and by category across years and quarters. Two bar charts show performance by department, one displaying closed versus open items by department, the other showing the age bracket distribution of items across departments. A workflow status bar chart and donut chart show the current pipeline stage of all active items. A dynamic Summary narrative panel auto-generates a plain-language Board report paragraph that updates with every filter selection.
Page 2 - Detailed Closed and Open Items by Department

A drill-through detail page accessible by right-clicking any department bar on the Summary page. The page automatically filters to the selected department and displays a dynamic title (e.g. Feedback Detail - Maritime Services | Over 28 days | 31 items), summary KPI cards for that department, and a full record-level table showing all feedback items with complete customer contact details, location descriptions, assigned user, action taken, and workflow status. A Back button returns users to their previous Summary page position with all filter selections preserved.
Page 3 - Brought Forward Items
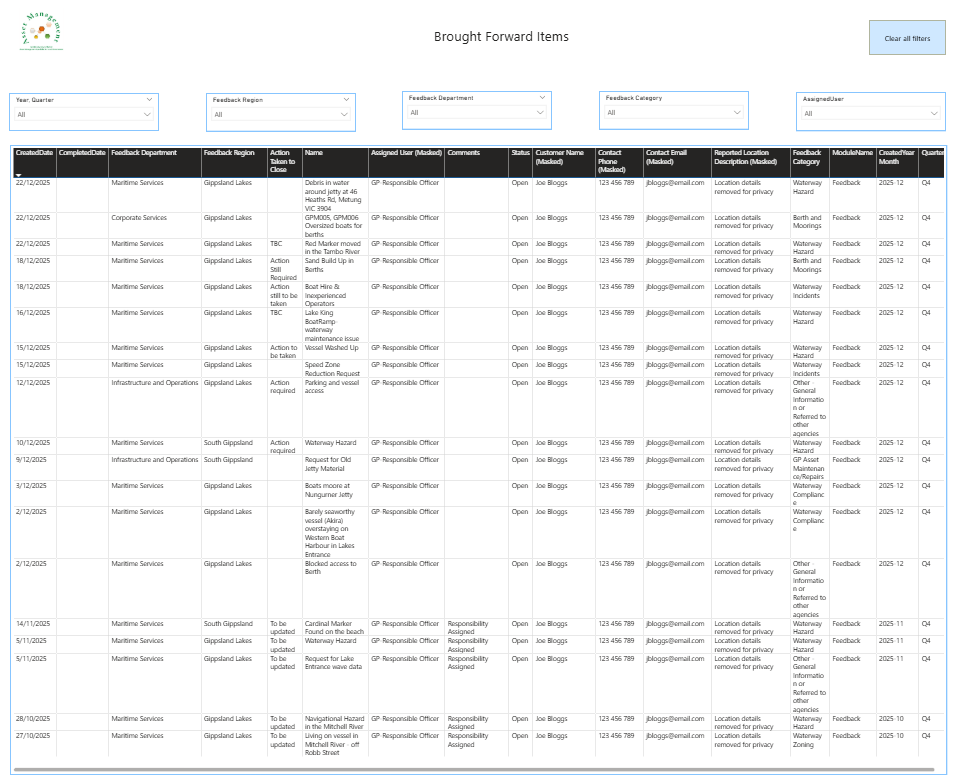
A dedicated operational page showing all open feedback items created before the current calendar year that have not yet been resolved. The page includes five filter controls allowing the team to isolate brought forward items by region, department, category, and assigned user. The full record table enables team leaders to identify the oldest unresolved items, items with no assigned owner, and items awaiting decisions, and to prioritise workload accordingly.
Page 4 - All Data

A complete searchable and exportable dataset page providing access to every feedback record with all fields visible. Six filter controls allow filtering by year, quarter, region, department, category, assigned user, and status. Records can be sorted by any column and exported to Excel or CSV for further analysis. This page serves as the operational reference for staff looking up individual records, verifying data accuracy, or preparing lists for follow-up activity.
4. Technical Highlights
FormField Pivot - SQL Architecture
The most technically complex element of the project was transforming the FormField table from its row-per-field structure into a usable report dataset. The Asset Vision Feedback System stores values like Customer Name, Contact Email, Feedback Details, and Action Taken to Close as individual rows with a Name column containing the field identifier and a Value column containing the data. A SQL query with conditional aggregation (MAX CASE WHEN) pivoted these rows into columns, with LIKE pattern matching on the Name field to handle the Section|FieldName prefix format used by the source system.
Dual Relationship Time Intelligence
The report required closed items to be plotted against their completion month and new items against their creation month on the same chart axis. This was achieved using an inactive relationship between the Feedback table's CompletedDate and the time axis, activated selectively using the DAX USERELATIONSHIP function within the Closed Items by Close Month measure. This approach is a Power BI best practice for bi-temporal reporting and required careful data model design to avoid relationship conflicts.
Slicer-Immune Cumulative Running Total
The Cumulative Open Items metric required a running total that accumulated across time periods while remaining completely unaffected by region, department, category, and status slicers. This was achieved by combining a DAX base measure using ALL() to remove slicer filter context with a Power BI visual calculation using RUNNINGSUM(COLUMNS) to accumulate the values left to right across the matrix columns. The combination of a filter-immune base measure with a visual-level running sum is a sophisticated pattern that is not achievable with either approach alone.
Dynamic Plain-Language Narrative
The Summary narrative panel was built using a series of DAX label measures that each return a complete sentence rather than a numeric value. Directional language (increased versus decreased) is determined dynamically by comparing current and prior year values within the measure itself.
Percentage values are formatted to display (73% rather than 0.73). The measures include null-safe handling using COALESCE and ISBLANK to ensure the narrative always returns a complete, grammatically correct sentence regardless of filter context, eliminating the empty placeholder problem that occurs when a measure returns blank in a narrative visual.
5. Results & Outcomes
Board Reporting Capability
Gippsland Ports Staff now have access to a self-service reporting tool that provides instant visibility of feedback volumes, resolution performance, and backlog status across all regions, departments, and categories. End users can apply filters to focus on specific regions or time periods and generate a tailored plain-language narrative summary without any manual drafting reducing report preparation time and improving the consistency and accuracy of Board papers.
Operational Visibility
Operations managers can now see at a glance which departments carry the highest open item loads, which feedback categories are most frequently reported, and whether resolution performance is improving or declining over time. The Age Bracket chart immediately identifies whether items are being resolved quickly or accumulating in the over-28-days category a critical early warning indicator for resourcing decisions.
Backlog Management
The Brought Forward Items page gave the organisation a systematic view of inherited backlog feedback items that had been logged in previous periods without being resolved. This page enables team leaders to identify items with no assigned owner, items with placeholder comments, and items that had been waiting without action for extended periods. The Cumulative Open Items running total in the Feedback Region matrix provides a continuously updated view of how the total open workload is evolving over time.
Data Quality Insights
The process of building the SQL queries and Power BI data model revealed several data quality observations including the partial nature of the Excel export provided (covering IDs up to 36,000 of a total range to 125,287), fields stored in FormField that were not visible in the Module table export, and the absence of a direct foreign key relationship between the Job and Feedback tables in the available dataset. Although these were not necessarily data quality issues, it did make building the SQL queries to extract the data more complex.
Documentation & Knowledge Transfer
A comprehensive user guide was produced during the engagement and covers all four report pages in detail, including step-by-step drill-through instructions with exact menu option names matching the live report, documents all filter controls, explains every visual and what to look for in it, provides a tips quick reference table, and includes a full glossary of terms.
6. Deliverables
Deliverable | Description |
SQL Queries | Five production-ready SQL SELECT queries for Feedback, FormField (raw and pivoted), Job, WorkflowStatus (latest and history), with all derived columns included. |
Power BI Data Model | Fully configured data model with active and inactive relationships, calculated columns, and DAX measures library. |
Power BI Report - Page 1 | Feedback Summary executive dashboard with six KPI cards, two matrix visuals, two bar charts, workflow status visuals, and dynamic narrative panel. |
Power BI Report - Page 2 | Detailed Closed and Open Items by Department drill-through page with dynamic title, KPI cards, and full record table. |
Power BI Report - Page 3 | Brought Forward Items operational page with five filters and full record detail table. |
Power BI Report - Page 4 | Feedback - All Data complete searchable dataset page with six filters and export capability. |
User Guide | Feedback Report guide covering all four pages with instructions on how to navigate the report, use the drill-through, drill up/drill down, filters, KPI cards, matrix, charts, and narrative instructions. With Tips Quick Reference section and Glossary. |
7. Project Highlight
One of the most rewarding aspects of this project was the strong level of engagement and collaboration demonstrated by the Gippsland Ports team. From the outset, staff were open about the challenges they were facing and brought valuable operational knowledge to the table. Their willingness to share insights into existing processes, constraints, and pain points provided a solid foundation for designing a solution that was both practical and meaningful. It was clear that the team had a genuine commitment to improving how feedback data was managed and used across the organisation.
Throughout the project, the Gippsland Ports staff maintained a highly professional and constructive approach to communication. They were responsive, thoughtful in their feedback, and proactive in working through challenges as they arose. This created a collaborative environment where ideas could be explored openly, and solutions refined iteratively. The team demonstrated a strong ability to adapt to new ways of working, and their openness to change played a key role in the successful adoption of the Power BI solution. Their focus on continuous improvement ensured that the final outcome not only addressed immediate reporting needs but also supported longer-term operational insights and decision-making.
8. About Iamdata Solutions
Iamdata Solutions Pty Ltd is a specialist data and analytics consultancy providing Power BI report design, SQL development, data modelling, business intelligence strategy, and asset management advisory services to government, utilities, infrastructure, and commercial clients across Australia.
With extensive experience in infrastructure asset management, Iamdata Solutions helps organisations turn complex operational data into practical insights that support informed decision-making and sustainable asset outcomes.
Our approach combines deep technical expertise in Microsoft Power BI, SQL Server, DAX, and Power Query with a commitment to producing reports and documentation that are genuinely usable by the end users who depend on them. We believe that the best data solution is one that empowers decision makers, not one that requires a data analyst to interpret it.
Contact Details
Consultant: Jill Singleton
Phone: 0423 240 439
Website: www.iamdata.solutions
If this resonates with you, whether you're still wrestling with manual spreadsheet reports, sitting on a wealth of data that isn't telling you anything useful yet, or simply curious about what Power BI could do for your organisation, then I'm here to help. Every dataset has a story worth telling and I'd love to help you understand what your data is telling you. Feel free to reach out.

I have worked on many different projects with my Local Government clients, from designing and developing Power BI Reports, to building SQL Server databases for spatial data, to managing and maintaining GIS and the Asset Management systems. If you'd like to discuss how we might work together, then please email Jill at ➡️ jill.singleton@iamdata.solutions
If you would like to receive the latest Newsletter Blog straight to your inbox, please subscribe here: ➡️ https://www.iamdata.solutions/subscribe
You can read all our Newsletters and Blogs here:➡️ https://www.iamdata.solutions/blog
You may also be interested in our Projects Page:➡️ https://www.iamdata.solutions/past-projects
Check out what our clients say about us here:➡️ https://www.iamdata.solutions/reviews
If you would like to see a particular topic covered in these newsletters, then please let me know about it. The chances are other people will be interested and would like to hear about it too! Please email me at: ➡️ jill.singleton@iamdata.solutions with your suggestions.


Comments